There are plenty of reasons to use GDB, as it is a general purpose debugger, but you will find it particularly useful in two circumstances in this course:
- You have a binary and you’d like to determine the state of the machine (registers, stack, instructions, etc.) during its run.
- You are writing C code, figured out that you have a bug, and you need to examine variables and state. First, we’ll describe how to get going in GDB, and then we’ll cover these use cases.
Running a Program in GDB
Throughout this example, we will discuss an example program called program which is compiled from program.c.
When compiling for use with GDB, make sure to give clang the -g flag which adds debugging symbols that GDB can use.
The command gdb program will open an instance of gdb with the program loaded. It will not automatically run. To run the program,
you should use the run command. If the program takes any arguments, you can put them right after run. If you want to re-make your
code, you can just type make into the GDB prompt.
However, just running a program in GDB is often not what you want. Just like in IntelliJ, GDB has the concept of a “breakpoint” where you can ask GDB to stop
on reaching a specific line. In GDB, there are three ways to specify breakpoints (using the b command):
b (setting a breakpoint)
-
b *0x4004af(by address) -
b main(by function) -
b program.c:10(by line)
Inspecting Program State
After making a breakpoint and running the program, if you’ve installed the CS 24 infrastructure correctly, you should be dumped into a screen that looks something like this:
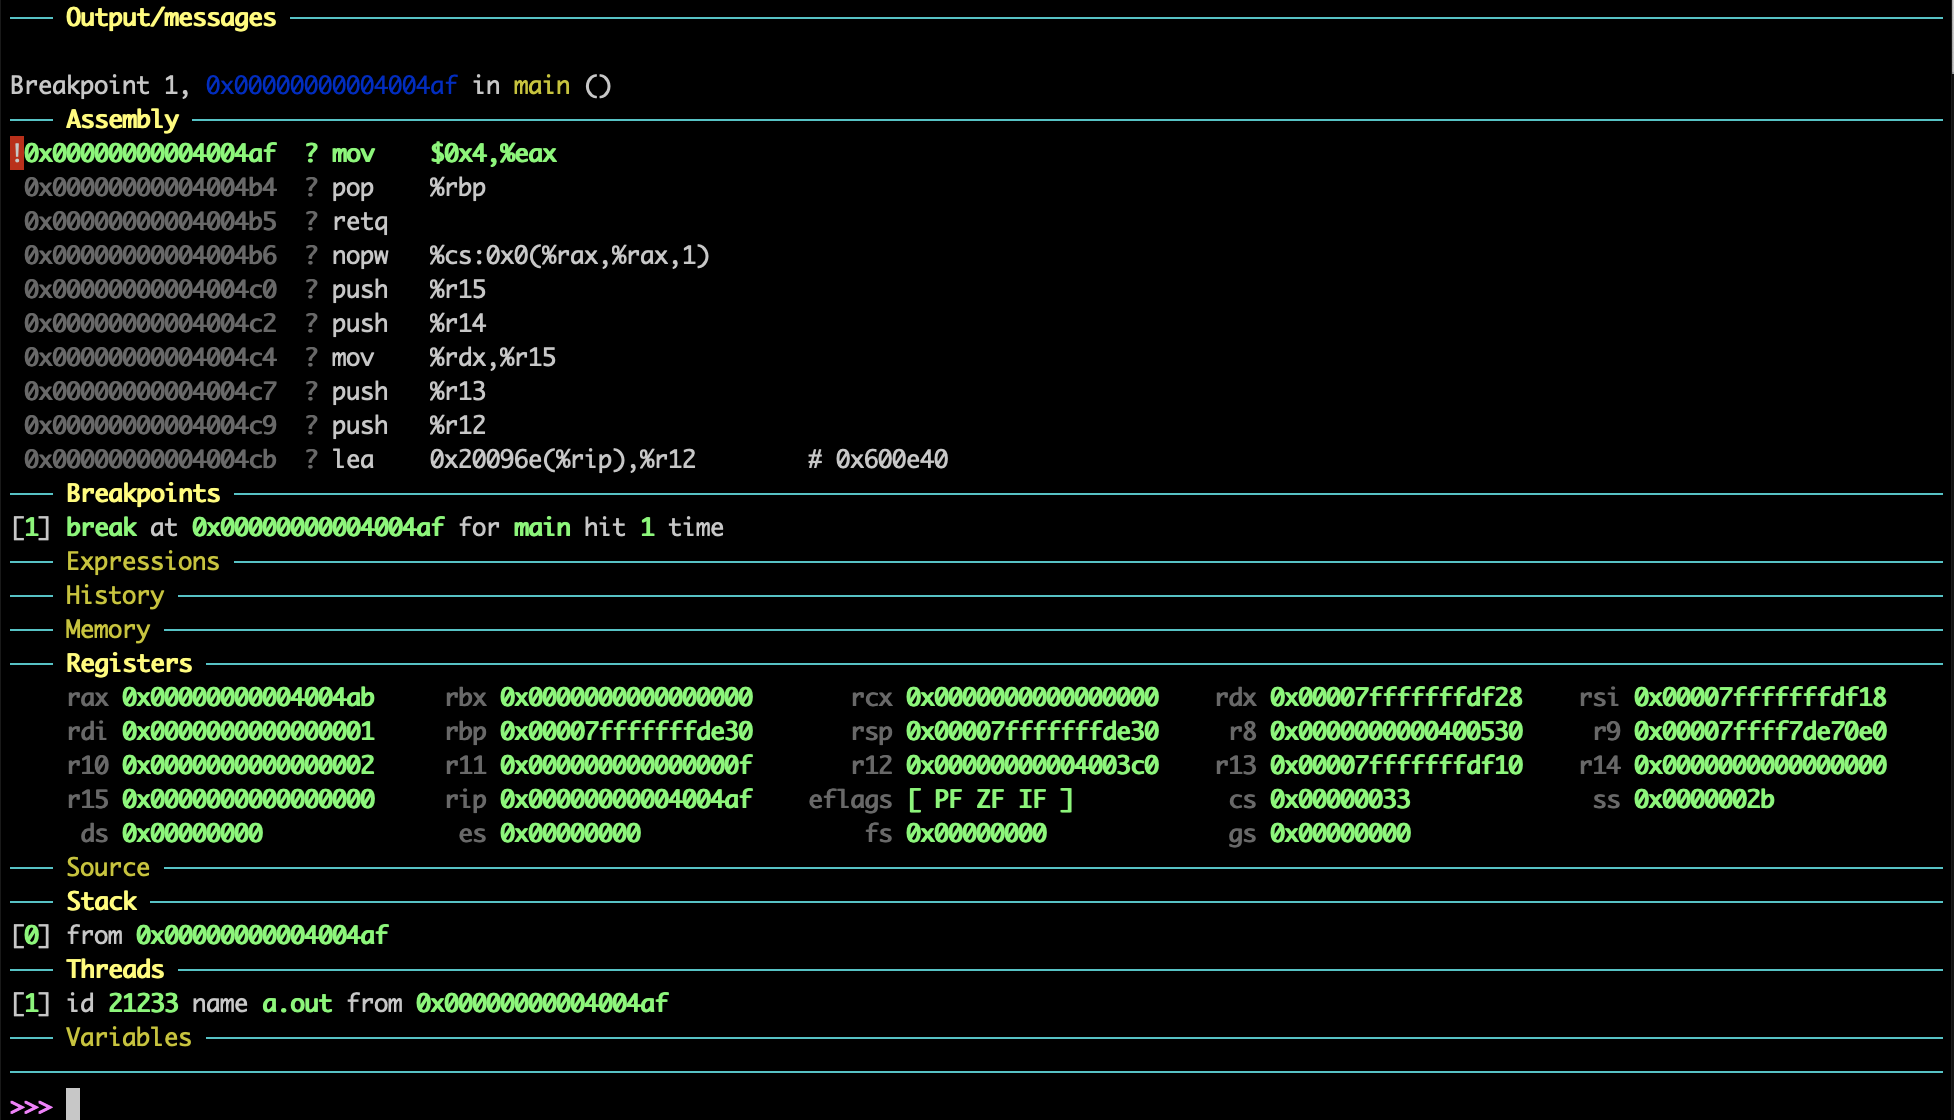
If your view does not look like this, run the cs24-setup command again.
Notably, this view shows you the assembly, registers, and call stack. Conspicuously missing is the stack. To show the memory around %rsp, run the following command:
dashboard memory watch $rsp-64 128
Then, GDB will show bytes in the “Memory” tab which will update throughout running the program. You will have to run this command every time you start GDB if you want to see the stack.
Here are some more useful commands:
-
si(stepping one instruction)siwill step one instruction forward in the program. -
s(stepping one line)swill step one line in the program. It will enter any functions being called. -
cont(continue executing)contwill continue execution after it was stopped at a breakpoint. -
finish(finishing a function)finishwill step to the end of the current function call. It will return to the previous call-site. -
p(printing a variable or expression)-
p y(prints the value of the variabley) -
p y + 100(prints the value of the expressiony + 100) -
p $rsp(prints the contents of therspregister) -
p/x *(char *)$rsp(print the value of the contents of%rspas achar *in hex)
-